You can drill down into your data in most widgets to get an in-depth view of a selected value.
Example
The pie chart on the left shows a breakdown by gender. On the right side, the chart shows the chart drilling down showing the age groups of the female segment from the original pie chart.
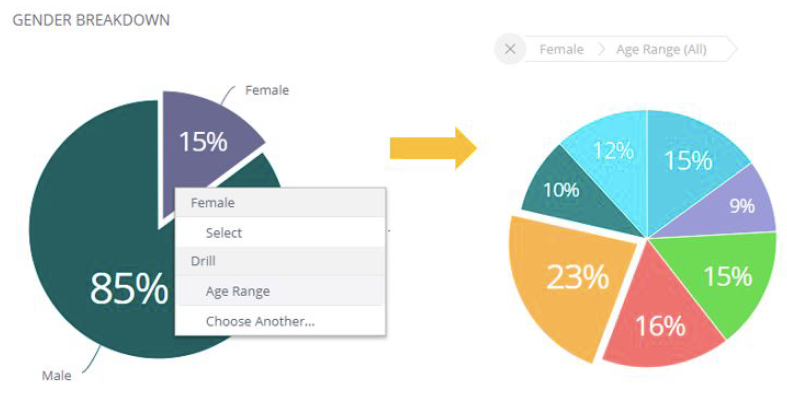
Right-click your mouse in the widget portion that you want to drill into.
Do one of the following:
Manual Drill Hierarchy
Select Drill Into.
In the Data Browser, select the field you want to drill. If this is the first time you drill down into a section, select Choose Another Field. If you have already drilled into this chart, shortcuts display for previously selected fields.
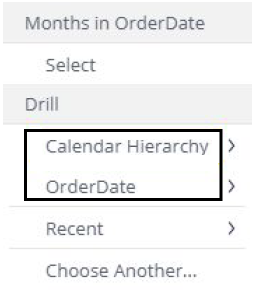
Predefined Drill Hierarchy (If available)
If the owner of your dashboard has defined predefined drill hierarchies, they will display in the Drill section.