You can combine chart widgets and display one or more selected fields using a different dashboard widget type.
For example, you might want to combine a line chart with a column chart to visually convey the interaction of the data points. We'll start with the column chart.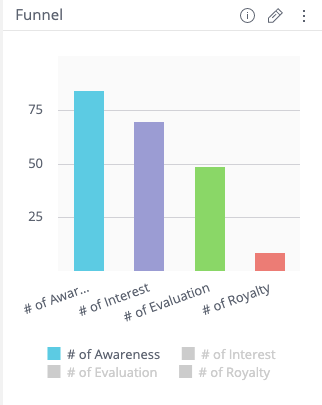
- Open a dashboard or create a new one.
- Identify a widget and select the pencil icon to edit it.
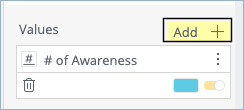
- In the left panel, add a minimum of two fields to Values.
- In the new value, click the vertical ellipses and then select Series Type.
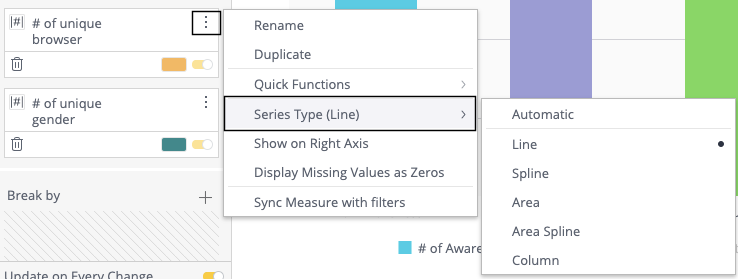
- Choose the style for the Series Type.