Review the following options to customize widget colors:
Treasure Data supports the following options to customize widget colors:
- Single Color. Specific color for all values.
- Range. A range of colors.
- Conditional. Colors based on conditional data.
Open a dashboard or create a new one.
Identify a widget and select the pencil icon to edit it.
In the left panel, select a color value.
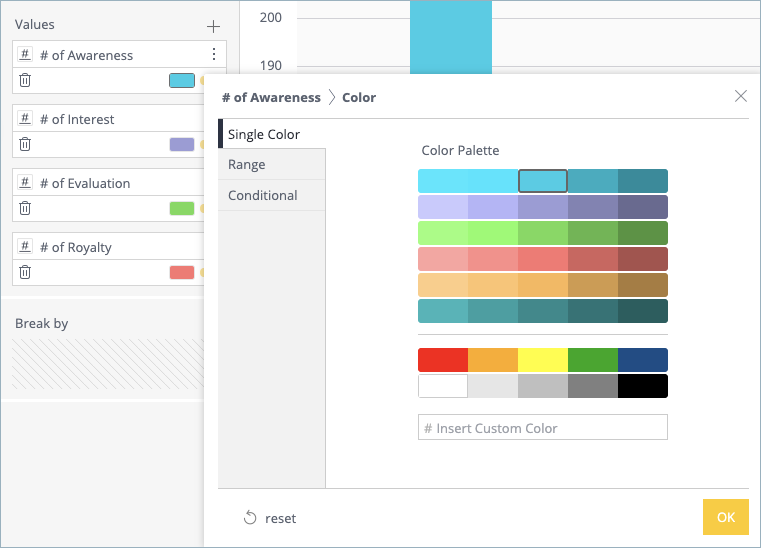
Select Single Color.
Select a different color or enter an HTML color code.
Click OK.
Treasure Insights supports color ranges for column and bar charts only.
Open a dashboard or create a new one.
Identify a widget and select the pencil icon to edit it.
In the left panel, select a color value.

Select Range and then select Manual.
Configure the color range:
- Change minimum and maximum colors. Select the left or right colored rectangles and choose a different color. Select OK.
- Customize a color range:
- Set a minimum color value. All values below the set minimum are assigned to the color on the left.
- Set a maximum color value. All values above the set maximum are assigned to the color on the right.
- Define a color range with steps. Select Transition and then specify the number of steps to define the number of colors in the range. Select Gradient for a linear color range.
Treasure Insights supports the ability to use a logical expression to define colors based on the value of a field.
Open a dashboard or create a new one.
Identify a widget and select the pencil icon to edit it.
In the left panel, select a color value.
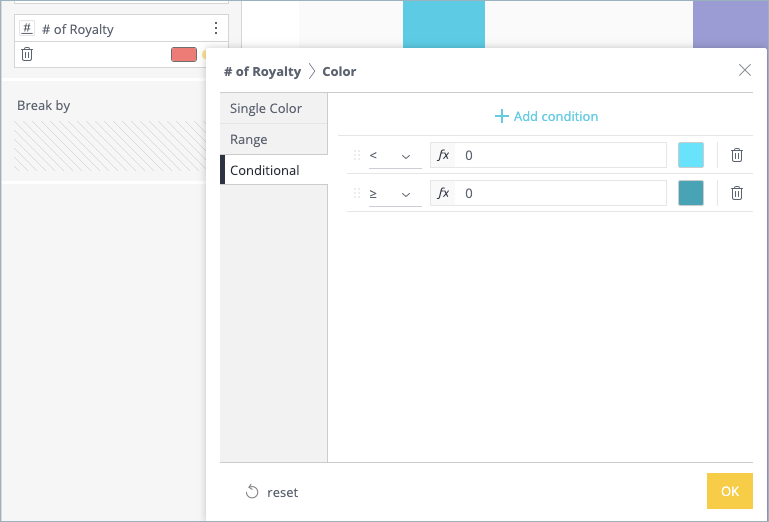
Select Conditional.
Each row represents a condition to which you can apply a value. If the condition is true, the value display in the color you select for the row. For example, you might want to create a condition that displays red when a negative condition is met, or green if the value is positive.Define an expression for each row:
- Select an operator and specify a value. For example, ...
- Select a color for the field.
- (Optional) Select + Add condition to add additional condition row.
Select OK.